CYOU firing on all cylinders (bullish)
Tech Rating: 3
Tech ratings are 3 to -3 indicating bullish to bearish; a zero is neutral to cautionary.

Changyou has filp flopped several times since our coverage began, but now is in a perfect buy bullish setup according to our rating system. All of our indicators are positive with no overbought levels.
Chartists will note, however that the stock has yet to close back above the 29.25 of Feb 5. For that reason, we advise keeping a close stop; the stock has moved more than 10% on both uptick and downtick days and thus until the break of 29.25 a 6-7% stop from your entry price seems like good risk management.
Price and moving averages:
Changyou.com has closed above its short term moving average.
Short term moving average is currently above mid term, and above long term moving averages.
Mid term moving average is currently above long term
The relationship between price and moving averages is: bullish in short term, and bullish in mid-long term.
Bollinger Bands:
CYOU has closed below upper band by 18.1%.
Bollinger Bands are 17.9% wider than normal.
The current width of the bands (alone) does not suggest anything conclusive about the future volatility or movement of prices.
CCI is now in positive range and generated no signals during last 5 periods.
MACD
Crossovers:
Currently MACD is bullish since it is trading above its signal line.
MACD crossed above its signal line 2 bars ago.
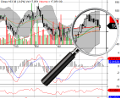
Since MACD crossed its moving average, CYOU's price has increased 3.59%
and has ranged from a high of 28.73 to a low of 26.67
MACD is not in an overbought/oversold range.
There have been no divergence signals within the last 5 periods.
**This commentary is for educational purposes only. It is not a recommendation to buy or sell. Use at your own risk.
About the Technical Rating Indicator
The Technical Rating Indicator combines established methods of technical analysis along with regression analysis and a weighting system based on signal strength to provide a technical rating. Note that none of the indicators use standard settings, and none of the settings have been optimized to fit a particular data set (avoiding in-sample bias).
The result is a clean, proprietary technical research rating system.
The Technical Rating Indicator is expressed in values ranging from -3 to +3.
A technical rating of -3 is issued when all individual indicators are exhibiting readings consistent with previous periods of negative prices (i.e. conditions are “bearish” for the stock price, based on historical analysis). A technical rating of +3 is issued when the individual indicators are exhibiting readings consistent with previous periods of positive price movement (i.e. conditions are “bullish” for the stock, based on historical analysis). Intermediate readings indicate a mix of signals from the inputs to the Technical Rating Indicator.
Disclosure: the firm does not currently hold a position in this stock and has no plans to create a long or short position over the next 5 business days.
Categories:


0 comments:
Post a Comment